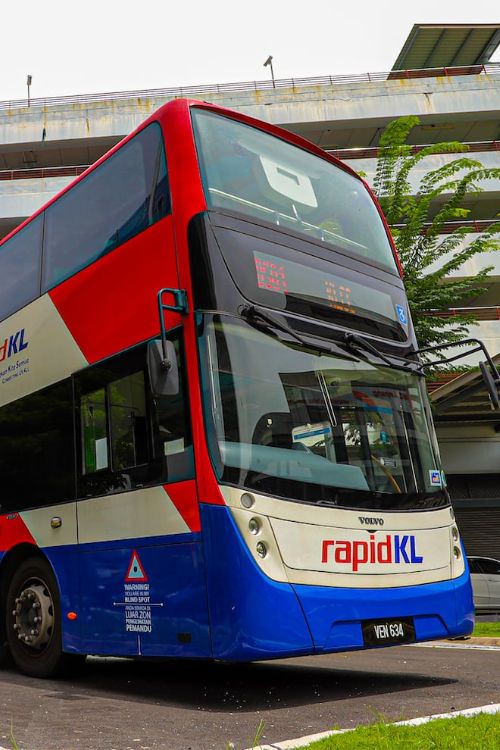
Rapid Bus Performance Update
Weekly Updates

Transparency and accountability are core values that we uphold in our operations. We believe that providing timely and accurate information to our passengers and other stakeholders is essential in continuously improving our services and identifying areas for improvements. We hope that this, in turn, will help build trust and confidence in our services.
The following are the latest performance numbers, which will serve as a roadmap for improving our services and achieving even greater success in the future.
For Rapid Rail performance, click here.
- Ridership
- Load Factor
- Service Reliability
- Service Availability
- Facilities Update
2025 Bus Ridership Overview
Monthly Ridership
| Rapid KL | MRT Feeder | BRT Sunway | Rapid Penang | Rapid Kuantan | Monthly Ridership | |
|---|---|---|---|---|---|---|
| January | 4,350,896 | 1,512,120 | 437,756 | 1,500,325 | 70,019 | 7,871,116 |
| February | 4,172,229 | 1,455,372 | 488,750 | 1,302,770 | 69,469 | 7,488,590 |
| March | 4,403,722 | 1,521,250 | 548,314 | 1,372,950 | 76,427 | 7,922,663 |
| April | 4,568,034 | 1,622,292 | 513,695 | 1,383,024 | 76,647 | 8,163,692 |
| Year | Rapid KL | MRT Feeder | BRT Sunway | Rapid Penang | Rapid Kuantan | Total |
|---|---|---|---|---|---|---|
| 2019 | 109,329,555 | 16,606,586 | 4,461,096 | 26,844,368 | 2,750,943 | 159,992,548 |
| 2020 | 53,524,942 | 8,889,275 | 2,182,299 | 13,026,263 | 1,148,559 | 78,771,338 |
| 2021 | 29,684,174 | 4,704,524 | 1,293,943 | 7,608,494 | 515,130 | 43,806,265 |
| 2022 | 35,072,170 | 8,060,708 | 3,615,899 | 11,464,196 | 806,671 | 59,019,644 |
| 2023 | 47,792,001 | 11,702,041 | 5,087,921 | 14,296,579 | 825,190 | 79,703,732 |
| 2024 | 52,218,378 | 17,014,714 | 5,835,458 | 16,270,231 | 975,677 | 92,314,458 |
Average Daily Ridership
(Weekday, excluding public holidays)
2025
-
Rapid Bus
Year | Average Daily Ridership |
|---|---|
2019 | 472,782 |
2020 | 235,425 |
2021 | 132,357 |
2022 | 178,458 |
2023 | 240,461 |
2024 | 251,372 |
Year To Date (Up to 16 May) | Weekly Variance Year to Date (16 May) vs. Year to Date (9 May) | |
|---|---|---|
Rapid KL* | 135,743 | ▲ 0.11% |
MRT Feeder Bus | 60,924 | ▲ 0.27% |
BRT Sunway | 20,016 | ▲ 0.64% |
Rapid Penang | 47,250 | ▼ 0.13% |
Rapid Kuantan | 2,488 | ▼ 0.28% |
Remarks:
*Rapid KL ridership excluding shuttle services for KLIA Charter
Average Load Factor
Ratio of average passenger load versus passenger capacity (weekdays excluding Public Holidays: 7am – 9am and 5pm – 7pm). Used to assess efficiency and measures the actual utilisation of passenger carrying capacity.
Weekly Variance
Year to Date (16 May) vs. Year to Date (9 May)

This Week
52%
Last Week
47%
0%
5%
This Week
42%
Last Week
37%
0%
5%
This Week
55%
Last Week
46%
0%
9%

This Week
46%
Last Week
46%
0%
0%

This Week
8%
Last Week
13%
0%
5%
Remarks:
- Average load factor for Weekdays AM & PM peak hours, excluding public holiday.
- To increase load factor and improve reach and agility, plans are in place to replace the Rapid Bus fleet with smaller (mini) buses. The objective is to improve passenger capacity utilization and commuter experience.
Punctuality (First Stop)
This Week (16 May) | Last Week (9 May) | Variance | |
|---|---|---|---|
Rapid KL | 85% | 86% | ▼ 1% |
MRT Feeder Bus | 96% | 96% | - |
BRT Sunway | 92% | 93% | ▼ 1% |
Rapid Penang | 86% | 86% | - |
Rapid Kuantan | 86% | 86% | - |
Remarks:
- Stage bus punctuality refers to the degree of which buses adhere to scheduled arrival & departure times.
- Initiatives conducted in collaboration with DBKL & the Selangor state to enforce and to improve Bus Lanes is crucial in improving travel time of Stage Buses.
Average Planned & Actual Bus-on-the-Road (BoTR)
This Week

This Week (16 May)
Last Week (9 May)

This Week (16 May)
Last Week (9 May)

This Week (16 May)
Last Week (9 May)

This Week (16 May)
Last Week (9 May)

This Week (16 May)
Last Week (9 May)
Remarks:
- Rapid KL excluding shuttle services for KLIA Charter
Station Facilities Update

Lifts
| Total Facilities | In Service Year To Date (Up to 16 May) | In Service Year To Date (Up to 9 May) |
|---|---|---|---|
BRT | 13 | 13 (100%) | 13 (100%) |
Remarks:
- No issue.

Escalators
Total Facilities | In Service Year To Date (Up to 16 May) | In Service Year To Date (Up to 9 May) | |
|---|---|---|---|
BRT | 25 | 25 (100%) | 25 (100%) |
Remarks:
-
No issue.

Lightings
Total Facilities | In Service Year To Date (Up to 16 May) | In Service Year To Date (Up to 9 May) | |
|---|---|---|---|
BRT | 5316 | 5316 (100%) | 5316 (100%) |
Remarks:
- No issue

Leaking
Faulty Year To Date (Up to 16 May) | Faulty Year To Date (Up to 9 May) | |
|---|---|---|
BRT | 0 | 0 |
Remarks:
- No Issue
- Ridership
- Load Factor
- Service Reliability
- Service Availability
- Facilities Update
2025 Bus Ridership Overview
Monthly Ridership
| Rapid KL | MRT Feeder | BRT Sunway | Rapid Penang | Rapid Kuantan | Monthly Ridership | |
|---|---|---|---|---|---|---|
| January | 4,350,896 | 1,512,120 | 437,756 | 1,500,325 | 70,019 | 7,871,116 |
| February | 4,172,229 | 1,455,372 | 488,750 | 1,302,770 | 69,469 | 7,488,590 |
| March | 4,403,722 | 1,521,250 | 548,314 | 1,372,950 | 76,427 | 7,922,663 |
| April | 4,568,034 | 1,622,292 | 513,695 | 1,383,024 | 76,647 | 8,163,692 |
| Year | Rapid KL | MRT Feeder | BRT Sunway | Rapid Penang | Rapid Kuantan | Total |
|---|---|---|---|---|---|---|
| 2019 | 109,329,555 | 16,606,586 | 4,461,096 | 26,844,368 | 2,750,943 | 159,992,548 |
| 2020 | 53,524,942 | 8,889,275 | 2,182,299 | 13,026,263 | 1,148,559 | 78,771,338 |
| 2021 | 29,684,174 | 4,704,524 | 1,293,943 | 7,608,494 | 515,130 | 43,806,265 |
| 2022 | 35,072,170 | 8,060,708 | 3,615,899 | 11,464,196 | 806,671 | 59,019,644 |
| 2023 | 47,792,001 | 11,702,041 | 5,087,921 | 14,296,579 | 825,190 | 79,703,732 |
| 2024 | 52,218,378 | 17,014,714 | 5,835,458 | 16,270,231 | 975,677 | 92,314,458 |
Average Daily Ridership
(Weekday, excluding public holidays)
2025
-
Rapid Bus
Year | Average Daily Ridership |
|---|---|
2019 | 472,782 |
2020 | 235,425 |
2021 | 132,357 |
2022 | 178,458 |
2023 | 240,461 |
2024 | 251,372 |
Year To Date (Up to 16 May) | Weekly Variance Year to Date (16 May) vs. Year to Date (9 May) | |
|---|---|---|
Rapid KL* | 135,743 | ▲ 0.11% |
MRT Feeder Bus | 60,924 | ▲ 0.27% |
BRT Sunway | 20,016 | ▲ 0.64% |
Rapid Penang | 47,250 | ▼ 0.13% |
Rapid Kuantan | 2,488 | ▼ 0.28% |
Remarks:
*Rapid KL ridership excluding shuttle services for KLIA Charter
Average Load Factor
Ratio of average passenger load versus passenger capacity (weekdays excluding Public Holidays: 7am – 9am and 5pm – 7pm). Used to assess efficiency and measures the actual utilisation of passenger carrying capacity.
Weekly Variance
Year to Date (16 May) vs. Year to Date (9 May)

This Week
52%
Last Week
47%
0%
5%
This Week
42%
Last Week
37%
0%
5%
This Week
55%
Last Week
46%
0%
9%

This Week
46%
Last Week
46%
0%
0%

This Week
8%
Last Week
13%
0%
5%
Remarks:
- Average load factor for Weekdays AM & PM peak hours, excluding public holiday.
- To increase load factor and improve reach and agility, plans are in place to replace the Rapid Bus fleet with smaller (mini) buses. The objective is to improve passenger capacity utilization and commuter experience.
Punctuality (First Stop)
This Week (16 May) | Last Week (9 May) | Variance | |
|---|---|---|---|
Rapid KL | 85% | 86% | ▼ 1% |
MRT Feeder Bus | 96% | 96% | - |
BRT Sunway | 92% | 93% | ▼ 1% |
Rapid Penang | 86% | 86% | - |
Rapid Kuantan | 86% | 86% | - |
Remarks:
- Stage bus punctuality refers to the degree of which buses adhere to scheduled arrival & departure times.
- Initiatives conducted in collaboration with DBKL & the Selangor state to enforce and to improve Bus Lanes is crucial in improving travel time of Stage Buses.
Average Planned & Actual Bus-on-the-Road (BoTR)
This Week

This Week (16 May)
Last Week (9 May)

This Week (16 May)
Last Week (9 May)

This Week (16 May)
Last Week (9 May)

This Week (16 May)
Last Week (9 May)

This Week (16 May)
Last Week (9 May)
Remarks:
- Rapid KL excluding shuttle services for KLIA Charter
Station Facilities Update

Lifts
| Total Facilities | In Service Year To Date (Up to 16 May) | In Service Year To Date (Up to 9 May) |
|---|---|---|---|
BRT | 13 | 13 (100%) | 13 (100%) |
Remarks:
- No issue.

Escalators
Total Facilities | In Service Year To Date (Up to 16 May) | In Service Year To Date (Up to 9 May) | |
|---|---|---|---|
BRT | 25 | 25 (100%) | 25 (100%) |
Remarks:
-
No issue.

Lightings
Total Facilities | In Service Year To Date (Up to 16 May) | In Service Year To Date (Up to 9 May) | |
|---|---|---|---|
BRT | 5316 | 5316 (100%) | 5316 (100%) |
Remarks:
- No issue

Leaking
Faulty Year To Date (Up to 16 May) | Faulty Year To Date (Up to 9 May) | |
|---|---|---|
BRT | 0 | 0 |
Remarks:
- No Issue


